At a Glance
Two corn grain particle size treatments were fed to beef x dairy crossbred cattle to determine effects on feedlot performance and incidence of liver abscesses. The feeding trial involved 30 steers and 30 heifers and was conducted over two periods. Rations fed in each period compared whole vs coarse rolled corn. There were no differences between treatments in weight, and average daily gain. Increased surface area of the corn due to rolling decreased daily intake and tended to improved feed efficiency due to improved starch digestion. Liver abscess incidence was very low, only two livers.
Introduction
Insemination of a portion of the dairy herd with beef semen has increased greatly since 2018. There is limited publicly available information on feedlot nutritional management of the resulting beef x dairy cross offspring regarding their growth performance and carcass characteristics, although there have been reports of increased incidence of liver abscesses in finished beef x dairy crossbred steers and heifers (Grimes et al., 2024). Liver abscesses cause financial loss to meat packers due to the interrupted pace of their processing lines along with increased food safety risks and product loss. There is a need for definition of lifetime best management practices for these cattle to optimize growth and carcass performance and minimize risk of liver abscesses and related gut health problems. Processing corn to reduce particle size and increase surface area can improve starch utilization and positively impact feed efficiency (Owens, 2005) but also increases risk of acidosis which can contribute to liver abscesses (Owens et al., 1998). Our hypothesis was that reduction in corn particle size would improve efficiency of weight gain, increase the incidence of liver abscesses, and decrease fecal starch concentration.
The objective of this study was to evaluate the effects of rolling corn grain to reduce particle size in a finishing ration on growth performance, fecal starch concentration, liver abscess incidence, and carcass characteristics of beef × dairy crossbred cattle.
Materials and Methods
A finishing trial was conducted with 30 steers and 30 heifers that were sorted by sex and stratified by weight into 10 pens of six head each (5 pens of heifers and 5 pens of steers). There was negligible difference between steer (average 712 lbs, SD 65 lbs) and heifer (average 692 lbs, SD 42 lbs) initial weights.
The cattle fed to finish in this trial were obtained within 5 days of birth by the University of Wisconsin (UW) Agricultural Research Station (ARS) at Arlington. Seven calves were from the UW ARS dairy herd, and the remainder were purchased from a nearby dairy farm and raised at UW ARS at Arlington. All cattle were from Holstein cows and sired by beef bulls. The specific sires and their breed compositions are not known. All calves had black or predominantly black hair coats. On initial arrival, they were used in a milk replacer additive trial. Aside from the milk replacer treatments (additive or control), all feeding and management prior to the finishing trial was the same for all the cattle and is summarized in Table 1. At the start of the finishing trial, the 30 steers and 30 heifers were approximately 8 months old (born between 6/3/23 and 6/19/23) with an average weight of 702 lbs. (SD 55 lbs.)
| Age | Housing and feeding |
| Arrival to day 50 | Individual housing, milk replacer (22% protein and 22% fat) and calf starter (commercial pellet and whole corn) |
| Days 51 to 70 | Individual housing, commercial pellet and whole corn, males castrated by knife |
| Days 71 to 75 | Individual housing, grain mix (18% protein) and free choice grass hay |
| Days 75 to 5 months of age | Group pens, pelleted grain mix (16% protein) and free choice grass hay |
| 5 to 8 months of age | Group pens, TMR of corn, UW-ARS Arlington dairy herd lactation ration refusals, soybean meal, monensin and free choice hay |
| Vaccinations | |
| 75 days | Intranasal and subcutaneous vaccinations against bovine respiratory disease and corona virus vaccination |
| 5 months | 7-way vaccination for clostridia with H. somnus, and subcutaneous booster against bovine respiratory disease |
| 10.5 months (during trial) | Booster vaccination for clostridia with H. somnus |
Two dietary treatments were randomly assigned to the pens within sex grouping. The dietary treatments were 1) whole corn, or 2) rolled corn. Three heifer pens and two steer pens received the whole corn treatment, with two heifer pens and three steer pens receiving the rolled corn treatment. Ration composition is shown in Table 2. Corn type was the only difference between rations. Feeding was done using bunk management to achieve maximal sustainable intake, with minimal feed refusal (only crumbs remaining).
| Ingredient | Ration DM formula, % |
| Corn silage | 15.0 |
| Corn | 63.3 |
| DDGS | 11.7 |
| Supplement* | 10.0 |
| Total | 100 |
| Calculated NEg, Mcal/lb DM | 0.61 |
The trial was conducted in two periods due to initial lack of ability to process (roll) the corn stored and used at the UW ARS Arlington Beef Nutrition Unit (BNU). A roller mill was purchased and installed at the BNU during the first period of the trial.
The first period (Period 1) was 71 days long, from 2/19/24 to 4/30/24, and compared dry rolled/cracked corn sourced from the UW ARS Arlington Feed Mill (AFM) and the whole corn at the BNU. Heifer pens had MGA top dressed on feed beginning 4/5/24, through harvest. The transition from dry cracked AFM corn to rolled BNU corn began on 4/17/24 and was completed by 4/30/24. The transition period was included in the growth performance data of Period 1.
The second period (Period 2) was 119 days long, from 5/1/24 to 8/28/24, and compared whole vs rolled corn from the BNU. Implants were administered the first day of Period 2 with heifers receiving Revalor-H and steers Revalor-S.
One of the heifers died on 8/20/24. A postmortem exam was not performed to determine cause of death.
Fecal samples were collected by grab sample AM and PM three weeks after starting the finish ration and three weeks prior to slaughter and analyzed for starch concentration using the method of Hall (2015). The cattle were shipped to Upper Iowa Beef, Lime Springs, IA on August 28, 2024, and harvested the next day after overnight stand. Internal organ defects and condemnations were recorded at harvest. Kidney, pelvic and heart fat (KPH) was removed from the carcass and weighed to determine KPH percentage. Carcasses were graded and additional carcass data was collected three days after harvest. Ribeye area, fat thickness and marbling score were determined using a MEQ Solutions Camera system and software https://www.meqprobe.com ↗️ .
Corn and ration properties
The whole corn used for this trial was from the Harvestore silo at the BNU. It was approximately 20% moisture, and as such was similar to dry corn. Owens (2005) indicated high moisture corn should have a moisture content of at least 26% to possess the nutritional advantages of immature kernels. The BNU corn was put into the silo using a blower and removed from the silo through the bottom unloader. There was minimal kernel damage and size reduction to the corn.
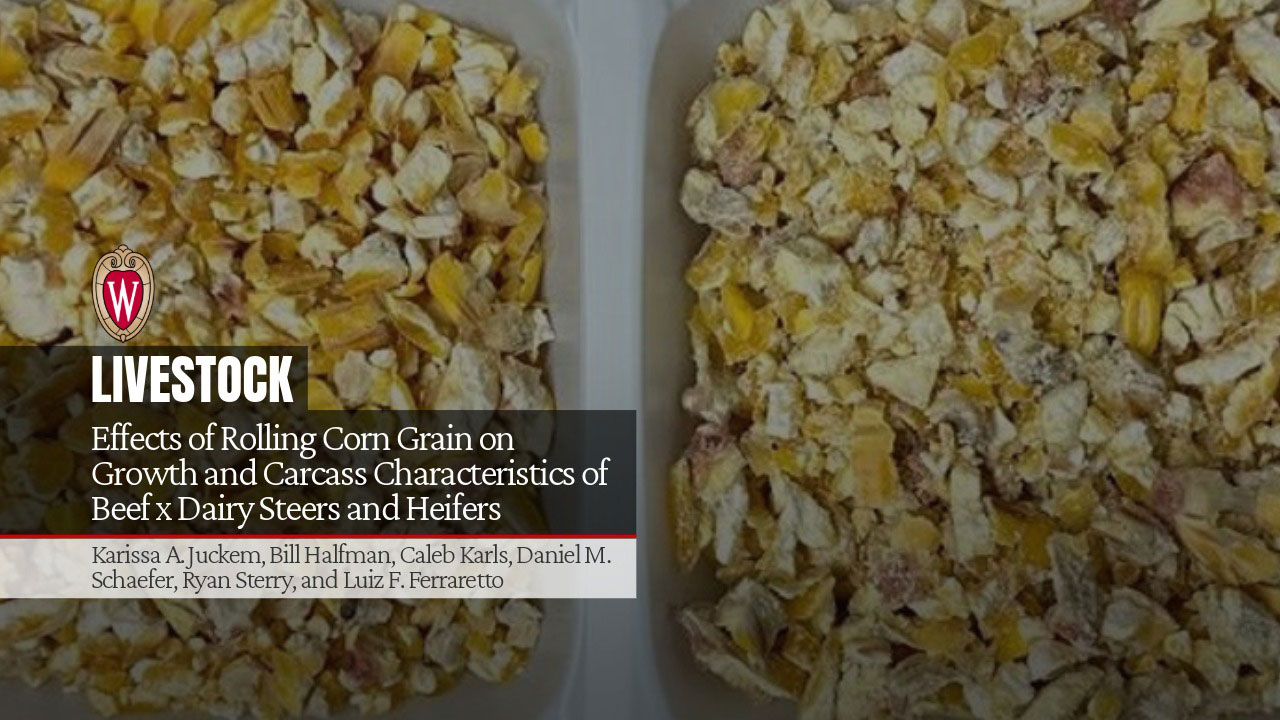
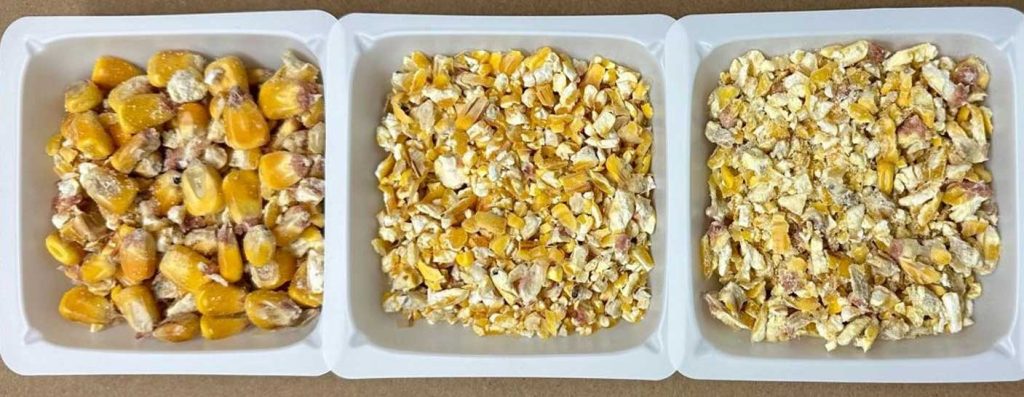
Determination of geometric mean particle size and surface area of corn grain was conducted as follows. Samples were dry-sieved using a vertical shaker (Tyler Ro-Tap Shaker model RX-812; Mentor, OH) and sieves with 4,760-, 2,380-, 1,191-, 595-, 297-, 149-, and 63-μm apertures plus bottom pan, with mean particle size and surface area calculated using a log normal distribution (Baker and Herrman, 2002). The picture below shows visual differences between the treatments and Table 3 provides the numerical measurements of the corn treatments.
| Whole BNU (Periods 1 and 2) | Rolled AFM (Period 1) | Rolled BNU (Period 2) | |
| Geometric mean particle size, microns | 4530 (SD 372) | 2312 (SD 421) | 2997 (SD 293) |
| Surface area, cm2/g | 11.0 (SD 1.9) | 21.3 (SD 3.2) | 18.3 (SD 2.0) |
| Period 1 | Period 2 | |||
| Whole BNU | Rolled AFM | Whole BNU | Rolled BNU | |
| Corn | ||||
| DM, % as fed | 79.4 ± 2.11 | 86.8 ± 2.78 | 80.5 ± 0.47 | 80.0 ± 0.71 |
| CP, % DM | 8.59 ± 0.16 | 9.22 ± 0.99 | 7.88 ± 0.21 | 7.94 ± 0.30 |
| NDF, % DM | 9.19 ± 1.67 | 9.73 ± 1.24 | 8.80 ± 0.75 | 9.08 ± 0.82 |
| Starch, % DM | 70.7 ± 0.54 | 69.3 ± 1.20 | 70.2 ± 1.32 | 68.9 ± 1.33 |
| EE, % DM | 2.96 ± 0.18 | 2.93 ± 0.63 | 3.41 ± 0.35 | 2.71 ± 0.68 |
| Ash, % DM | 2.69 ± 0.38 | 2.96 ± 1.25 | 2.35 ± 0.39 | 2.05 ± 0.34 |
| DMD3, % DM | 29.4 ± 5.74 | 44.1 ± 4.13 | 26.8 ± 2.39 | 43.1 ± 2.43 |
| TMR | ||||
| DM, % as fed | 64.8 ± 7.42 | 67.7 ± 7.66 | 72.2 ± 2.33 | 72.0 ± 2.39 |
| CP, % DM | 15.3 ± 0.33 | 13.8 ± 0.61 | 13.1 ± 0.26 | 13.2 ± 0.66 |
| NDF, % DM | 23.2 ± 2.12 | 23.0 ± 2.64 | 21.1 ± 1.22 | 20.1 ± 1.47 |
| Starch, % DM | 45.6 ± 4.08 | 46.7 ± 2.51 | 49.8 ± 2.39 | 51.6 ± 1.58 |
| Fat, % DM | 5.23 ± 0.19 | 4.85 ± 0.02 | 5.26 ± 0.45 | 5.67 ± 0.18 |
| Ash, % DM | 5.73 ± 0.42 | 5.41 ± 1.04 | 4.46 ± 0.35 | 4.26 ± 0.22 |
Statistical analysis
Data for the corn treatment comparison was analyzed as a completely randomized design by period with initial body weight or intake at the beginning of Period 1 used as covariate in a mixed model. The model included treatment, period, and their interaction as fixed effects, and pen(treatment) and sex as random effects.
Data for comparing steer versus heifer performance was analyzed as a completely randomized design by period with initial body weight or intake at the beginning of Period 1 and treatment used as covariate in a mixed model. The model included sex, period, and their interaction as fixed effects, and pen(treatment) as a random effect. Pen was the experimental unit for both comparisons.
Results and Discussion
Growth and feed efficiency
Animal growth performance and feed efficiency for both periods are shown in Table 5. The results are summarized for the combination of steers and heifers. There were no differences between treatments in initial and final weights and average daily gain (P>0.10) in both feeding periods. Increased surface area of the corn due to rolling decreased daily DM intake (P=0.03) and tended to improve feed efficiency (P=0.09) due to improved starch digestion (P=0.01). In Period 1, cattle fed the whole corn treatment averaged 1.1 lb/d greater DM intake and 0.37 greater lb DM/lb gain compared to the rolled corn treatment. In Period 2, cattle fed the whole corn treatment averaged 1.2 lb/d greater DM intake and 0.43 greater lb DM/lb gain. (P < 0.05) than cattle fed the rolled corn treatment. Fecal starch concentration was 7.3 and 10.3 percentage units greater (P < 0.05) for the whole corn grain ration for Period 1 and Period 2, respectively. Total tract starch digestibility (percentage of diet starch) was calculated according to Zinn et.al. (2007) equation. Period 1 calculated starch digestibility was 81.0 and 88.2 percent for whole and rolled corn respectively, for an 8.8% improvement. Period 2 calculated starch digestibility was 78.3 and 88.6 percent for whole and rolled corn respectively for a 13.2 % improvement.
| Period 1 (71 days) | ||||
| BNU Whole | AFM Rolled | SEM1 | P-value | |
| Pens | 5 | 5 | ||
| Initial wt., lb | 713 | 691 | ||
| Final wt., lb | 985 | 998 | 6.59 | 0.23 |
| ADG, lb/d | 4.05 | 4.23 | 0.09 | 0.23 |
| DM intake, lb/d | 23.1 | 22.0 | 0.001 | 0.03 |
| Feed:gain, lb DM: lb gain | 5.63 | 5.26 | 0.001 | 0.09 |
| Fecal starch, %DM | 25.4 | 18.1 | 2.01 | 0.01 |
| Period 2 (119 days) | ||||
| BNU Whole | BNU Rolled | SEM1 | P-value | |
| Initial wt., lb | 985 | 998 | 6.59 | 0.23 |
| Final wt., lb | 1489 | 1514 | 27.62 | 0.21 |
| ADG, lb/d | 4.15 | 4.27 | 0.20 | 0.48 |
| DM intake, lb/d | 28.7 | 27.5 | 0.001 | 0.03 |
| Feed:gain, lb DM: lb gain | 6.92 | 6.49 | 0.001 | 0.09 |
| Fecal starch, %DM | 27.9 | 17.6 | 2.01 | 0.01 |
Carcass Quality, Yield and Internal Organ Condition
There were no differences in carcass traits between corn treatments (P >0.10). Carcass data is shown in Table 6.
| Whole corn | Rolled corn | SEM3 | P-value | |
| Pens | 5 | 5 | ||
| Hot carcass wt., lb | 861 | 883 | 14.82 | 0.12 |
| 1Dressing percentage | 60 | 61 | 0.003 | 0.36 |
| Rib fat, in | 0.55 | 0.60 | 0.10 | 0.37 |
| Ribeye area, in2 | 12.6 | 13.1 | 0.30 | 0.37 |
| Ribeye: 100 lb carcass wt, in2 | 1.47 | 1.49 | 0.04 | 0.76 |
| KPH fat, % | 4.34 | 4.02 | 0.37 | 0.22 |
| 2Marbling score | 669 | 676 | 30.11 | 0.83 |
| Yield grade | 3.72 | 3.79 | 0.25 | 0.76 |
Quality and yield grade distribution of the cattle is shown in Table 7. Quality grade distributions were similar between treatments.
| Whole corn | Rolled corn | |
| Head | 29 | 30 |
| Quality grade distribution (%) | ||
| Prime | 34.5 | 40.0 |
| Choice high | 34.5 | 26.7 |
| Choice average | 31.0 | 30.0 |
| Choice low | 0 | 3.3 |
| Select | 0 | 0 |
| Yield grade distribution (%) | ||
| YG1 | 0 | 0 |
| YG2 | 20.7 | 10.0 |
| YG3 | 44.8 | 60.0 |
| YG4 | 31.0 | 30.0 |
| YG5 | 3.5 | 0 |
There was a very low incidence of internal organ condemnations. Table 8 summarizes internal organ condemnations by treatment.
| Organ | Whole corn | Rolled corn |
| Liver, due to abscesses, n | 2 | 0 |
| Gut, n | 1 | 1 |
| Heart and lung pluck, n | 2 | 2 |
Comparing Steers and Heifers
This trial provided an opportunity to evaluate steer and heifer growth performance and carcass traits under the same controlled conditions. Statistical analysis was conducted with corn treatment and initial weight included as a covariate in the analysis to account for their effects
There were no differences (P>0.10) between heifer and steer performance during Period 1. In Period 2, steers tended to have a higher rate of gain (P=0.06; 4.40 lb/day vs 4.02 lb/day) and final weights (P=0.06; 1524 lb vs. 1478 lb). There was no difference (P>0.10) in fecal starch concentration between the steers and heifers in either trial. Steers had greater hot carcass weight (P=0.05); 890 lb vs 854 lb, less rib fat (P=0.01; 0.48 in. vs 0.67 in.) and less KPH fat (P=0.03; 3.83 percent vs 4.52 percent) than the heifers. There were no differences (P>0.10) in dressing percentage, ribeye area, marbling score or yield grade between the steers and heifers.
| Heifer | Steer | SEM1 | P-value | |
| Period 1 (71 days) | ||||
| Pens | 5 | 5 | ||
| Initial Wt, lb | 691 | 712 | ||
| Final Wt, lb | 984 | 1000 | 10.1 | 0.29 |
| ADG, lb/d | 4.09 | 4.20 | 0.10 | 0.48 |
| DMI, lb/d | 22.8 | 22.3 | 0.29 | 0.31 |
| Feed:gain, lb DM:lb gain | 5.57 | 5.32 | 0.10 | 0.14 |
| Fecal Starch, %DM | 19.5 | 24.0 | 2.43 | 0.25 |
| Period 2 (119 days) | ||||
| Initial Weight | 984 | 1000 | 10.1 | 0.29 |
| Final Weight | 1478 | 1524 | 13.9 | 0.06 |
| ADG, lb/d | 4.02 | 4.40 | 0.11 | 0.06 |
| DMI, lb/d | 28.1 | 28.1 | 0.57 | 0.98 |
| Feed:gain, lb DM:lb gain | 7.01 | 6.40 | 0.23 | 0.11 |
| Fecal Starch, %DM | 22.9 | 22.7 | 1.78 | 0.93 |
| Heifer | Steer | SEM3 | P-value | |
| Pens | 5 | 5 | ||
| Hot carcass wt., lb | 854 | 890 | 9.94 | 0.05 |
| 1Dressing percentage | 61 | 60 | 0.01 | 0.58 |
| Rib fat, in | 0.67 | 0.48 | 0.04 | 0.01 |
| Ribeye area, in2 | 12.9 | 12.8 | 0.33 | 0.81 |
| Ribeye: 100 lb carcass wt, in2 | 1.52 | 1.44 | 0.03 | 0.11 |
| KPH fat, % | 4.52 | 3.83 | 0.17 | 0.03 |
| 2Marbling score | 697 | 649 | 21.1 | 0.17 |
| Yield grade | 3.96 | 3.55 | 0.17 | 0.14 |
Quality and yield grade distributions for the cattle are shown in Table 11. The yield grade results correlate with the fact that the heifers had greater backfat, KPH fat, and lighter carcass weights than the steers.
| Heifers | Steers | |
| Head | 29 | 30 |
| Quality grade distribution (%) | ||
| Prime | 37.9 | 36.7 |
| Choice high | 37.9 | 23.3 |
| Choice average | 20.7 | 40.0 |
| Choice low | 3.5 | 0 |
| Select | 0 | 0 |
| Yield grade distribution | ||
| YG1 | 0 | 0 |
| YG2 | 6.9 | 23.3 |
| YG3 | 48.3 | 56.7 |
| YG4 | 44.8 | 16.7 |
| YG5 | 0 | 3.3 |
Concluding Thoughts
The corn processing treatments in Periods 1 and 2 increased corn DM digestion rate by 50% and 61%, corn particle surface area by 94% and 66%, which reduced fecal starch concentrations to 71% and 63% of whole corn, implying improvements in starch digestibility of 9% and 13%, respectively. These large increases in corn surface area resulted in lower DMI and a trend for improved feed efficiency. The DMI, ADG, feed efficiency, and marbling results of these cattle were excellent. Since cattle finished to heavier weights were sought by the market, their carcasses had higher KPH and yield grade 4 or 5 percentages. The exceptionally low incidence of liver abscesses is noteworthy relative to Central and Southern Plains feedyard reports.
References
- Baker, S., and T. Herrman. 2002. Evaluating particle size. Bulletin No. MF-2051. Manhattan (KS): Feed Manufacturing. Kansas State University Agricultural Experiment Station and Cooperative Extension Service, Kansas State University.
- Grimes, B. B., T. J. McEvers, T. C. Tennant, J. W. Johnson, and T. E. Lawrence. 2024. Relationship of liver abnormalities with carcass performance and value. Appl. Anim. Sci. 40:358-375. https://doi.org/10.15232/aas.2023-02482
- Hall, M. B. 2015. Determination of dietary starch in animal feeds and pet food by an enzymatic-colorimetric method: Collaborative study. J. AOAC Int. 98:397–409. doi:10.5740/jaoacint.15-012.
- Owens, F. 2005. Impact of grain processing and quality on Holstein steer performance. Managing and Marketing Quality Holstein Steer Conference Proceedings. Rochester MN.
- Owens, F.N., D. S. Secrist, W. J. Hill, D. R. Gill, Acidosis in cattle: a review, Journal of Animal Science, Volume 76, Issue 1, January 1998, Pages 275–286, https://doi.org/10.2527/1998.761275x
- Zinn, R.A., A. Barreras, L. Corona, F.N. Owens, R.A. Ware. 2007. Starch digestion by feedlot cattle: Predictions from analysis of feed and fecal starch and nitrogen. J. Anim. Sci. 85:1727-1730.
Originally Published: August 2026
Authors
- Karissa A. Juckem – Department of Animal and Dairy Sciences, University of Wisconsin–Madison
- Bill Halfman – Division of Extension, University of Wisconsin–Madison
- Caleb Karls – Department of Animal and Dairy Sciences, University of Wisconsin–Madison
- Daniel M. Schaefer – Department of Animal and Dairy Sciences, University of Wisconsin–Madison (Emeritus)
- Ryan Sterry – Division of Extension, University of Wisconsin–Madison
- Luiz F. Ferraretto – Division of Extension & Department of Animal and Dairy Sciences, University of Wisconsin–Madison
Reviewers
- Brooke Latack – University of California Cooperative Extension (UCCE)
- Denise Schwab – Iowa State University Extension and Outreach